The Box Number Isn't Your Number: A Realistic Guide to Cartridge Yield
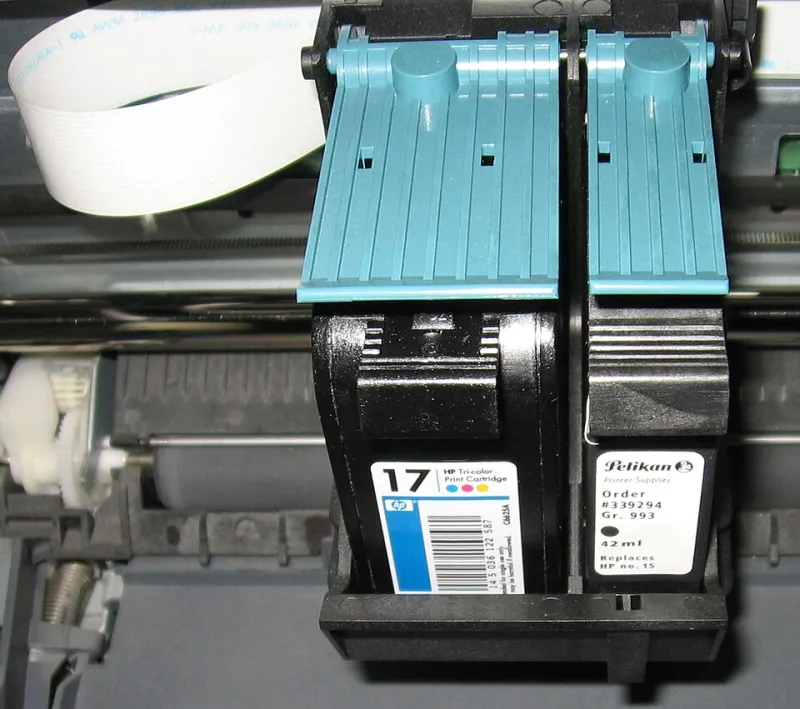
Photo: Julo, Public domain, via Wikimedia Commons
Pick up almost any ink cartridge in a UK supermarket or online listing and you'll see a page count: 200 pages, 300 pages, maybe 600 for an XL. It looks like a promise. In practice, it's closer to a lab result under very specific conditions. That doesn't make the number dishonest, but it does mean the figure on the box is a poor predictor of what you'll actually print at home.
What the yield figure actually measures
For inkjet cartridges, page yield is usually measured using ISO/IEC 24711, with test patterns from ISO/IEC 24712. Toner has its own standards, such as ISO/IEC 19752 for mono and ISO/IEC 19798 for colour. The important part isn't the code — it's the setup. The cartridge is run under controlled conditions, on default settings, using a standard set of documents that average around 5% page coverage.
Five per cent coverage is roughly a page of ordinary text with plenty of white space. Think a short letter, a simple invoice, or a plain covering note. It is not a geography worksheet with shaded maps, a photo-heavy birthday invitation, or a return label with a big barcode and logo. The yield figure is designed so you can compare one cartridge with another under the same test. It was never meant to tell you how many pages your household will get.
Why coverage changes everything
Coverage is the share of the page that receives ink. A plain text page might sit near 5%. A letter with a logo and a coloured heading might creep towards 10%. A school worksheet with boxes, images and bold instructions can easily hit 15% to 25%. A photo or a full-colour flyer can be 60% or more.
That difference matters because ink use scales with coverage, not with the number of sheets. If a cartridge is rated at 300 pages at 5% coverage, and your average job is closer to 15%, a simple linear estimate puts you nearer 100 pages. At 25% average coverage, it could be closer to 60. The real figure won't be exactly linear — printers also use ink for maintenance and head cleaning — but the direction is clear. Heavier pages mean fewer of them.
The hidden extras: cleaning cycles and standby
Inkjet printers are not just ink-on-paper machines. Many run cleaning cycles to keep nozzles healthy, especially after periods of inactivity or when switched on. Some use a small amount of ink when waking from standby. If you print two pages a week and leave the printer plugged in, a surprising share of the cartridge can disappear into maintenance rather than onto the page.
This is why two UK homes can buy the same cartridge and report wildly different page counts. One prints plain invoices on draft mode; the other prints photo-heavy homework and colouring pages on best quality. One switches the printer off at the wall between uses; the other leaves it on standby. One lives in a dry, warm flat; the other in a cooler spare room. The cartridge is identical. The printing habits are not.
Build your own estimate in four steps
You don't need lab equipment to get a more useful number. You need a fortnight of honest observation.
- Keep a print diary for two weeks. Note each job type: letters, invoices, homework, labels, photos, tickets, forms, school newsletters.
- Estimate coverage for each job type. Use rough bands: 5% for plain text, 10% for text with a logo or light colour, 20% for a busy worksheet, 60% for a photo, 100% for a full-page image.
- Work out your weighted average. Multiply pages by coverage, add them up, then divide by total pages. For example: 10 letters at 6%, 8 worksheets at 18%, 2 photos at 70% and 5 labels at 12% gives (60 + 144 + 140 + 60) ÷ 25 = 16.2% average coverage.
- Adjust the box figure. A rough estimate is quoted yield × (5 ÷ your average coverage). So a 300-page cartridge at 16.2% average coverage becomes 300 × 5 ÷ 16.2, or roughly 93 pages. Treat that as optimistic, because cleaning cycles still take their cut.
Once you have a realistic page count, cost per page becomes much more useful. Divide the cartridge price by your estimated pages. An £18 cartridge that realistically prints 93 pages works out at about 19p per page. A £9 compatible cartridge with a similar realistic yield would be nearer 10p per page. That comparison is far more meaningful than staring at the headline yield on the box.
Don't throw the standard away
The ISO figures still have a job. They let you compare an XL cartridge with a standard one, or an own-brand cartridge with a compatible, on a like-for-like basis. Just don't treat them as a personal forecast. Check whether both products quote yield using the same standard, and be wary of listings that mix page counts with vague claims like 'high capacity' without a test reference.
For toner, the 5% coverage standard is often closer to real office text printing, so the gap between box and reality can be smaller. But colour toner and graphics-heavy documents will still pull your real yield down. The principle is the same: the more ink or toner lands on each sheet, the fewer sheets you get.
A UK household reality check
In 2026, many UK homes print less overall but in bursts: school term starts, return labels after online shopping, council forms, Christmas cards, birthday invitations, and the occasional emergency document. Low-volume printing adds another wrinkle. A cartridge may dry out or clog before it ever reaches its quoted page count, which makes the cost per page look worse than the maths suggests. If you print only a handful of pages a month, reliability and clogging matter as much as yield.
The box number is a lab result. Your number is a household result. Use the box as a starting point, then adjust for your own pages, your own settings and your own printer's habits. That's the difference between buying ink on hope and buying it on a realistic cost per page.